San Jose del Cabo Real Estate Market Update — February 2026
Published by Pose Knows Cabo | March 2026 | Source: FlexMLS Los Cabos
The Los Cabos market had a strong February, with 121 total sales across all zones and property types bringing in over $90.7 million. Compared to a typical slow season, these numbers show solid demand from foreign buyers and local owners alike. Below is a full look at what happened in San Jose del Cabo and the wider Los Cabos market — and what it means if you are thinking about buying or selling this year.
February 2026 Los Cabos Market Snapshot
| Metric | All Sales | Non Co-op | Co-op | |
| Total Units Sold | 121 | 64 | 57 | |
| Total Sales Volume | $90,796,336 | $36,569,822 | $54,226,514 | |
| Average Sale Price | $750,383 | $571,403 | $951,342 | |
| Median Sale Price | $315,000 | $262,500 | $360,000 | |
| Avg. Sale vs List Price | -$45,872 | -$33,458 | -$59,811 | |
| Average Days on Market | 275 | 266 | 286 |
San Jose del Cabo — Sales by Property Type
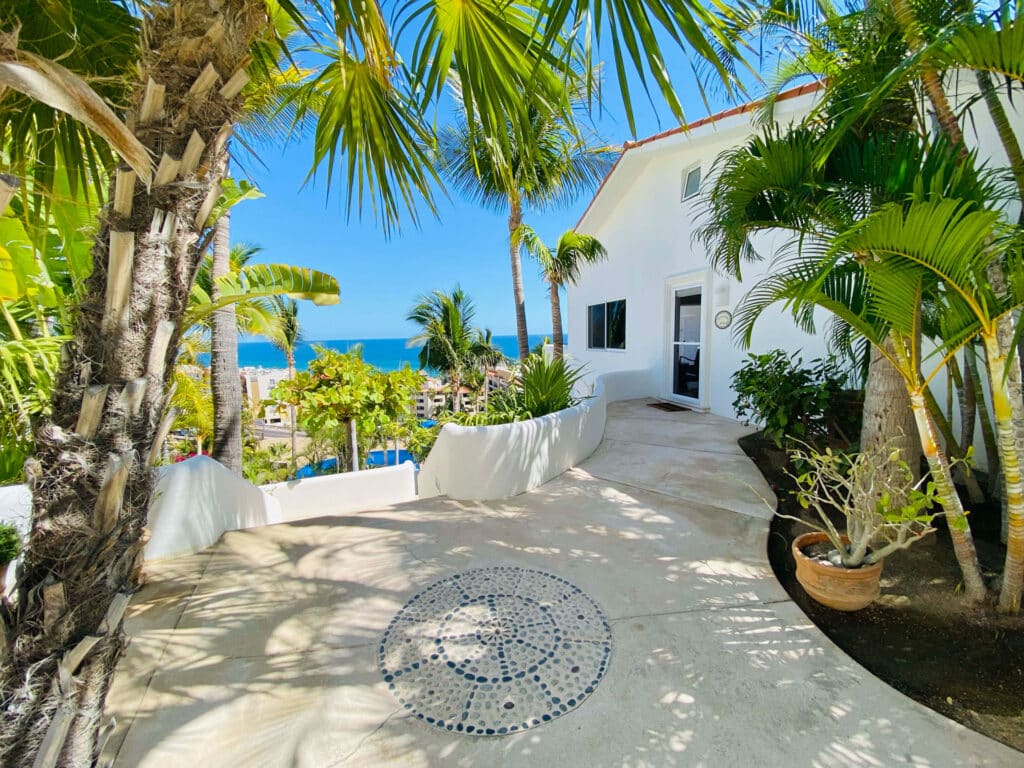
San Jose del Cabo was one of the busiest zones in Los Cabos in February. Notably, it saw strong sales across all three property types — condos, houses, and land — making it the most well-rounded market in the region this month.
| Type | Units | Volume | Avg Price | Median | SP vs LP | DOM |
| Condos | 9 | $4,489,584 | $498,843 | $536,751 | -$16,702 | 227 |
| Houses | 10 | $7,302,272 | $730,227 | $548,050 | -$79,726 | 237 |
| Land | 3 | $810,000 | $270,000 | $220,000 | -$25,462 | 263 |
| TOTAL | 22 | $12,601,856 | — | — | — | ~242 |
San Jose Corridor — Luxury Market Highlights
In contrast to San Jose del Cabo’s broad market, the San Jose Corridor led the luxury end. Average condo prices hit $2.67 million, while house prices averaged $6.9 million — the highest of any zone in Los Cabos this month. As a result, just 11 sales in the Corridor brought in nearly $41.4 million in total volume.
| Type | Units | Volume | Avg Price | Median | SP vs LP | DOM |
| Condos | 7 | $18,689,163 | $2,669,880 | $2,350,000 | -$75,593 | 560 |
| Houses | 3 | $20,750,000 | $6,916,667 | $6,450,000 | -$208,333 | 490 |
| Land | 1 | $1,925,000 | $1,925,000 | $1,925,000 | -$73,000 | 411 |
What This Means for Buyers and Sellers
For Buyers
- First, homes across Los Cabos are selling below asking price, with an average gap of -$45,872. This means there is room to negotiate, above all in the luxury segment.
- Also, San Jose del Cabo condos are selling fastest at just 227 days on market, compared to 560 days for San Jose Corridor condos. If you find a well-priced condo in SJD, therefore, act fast.
- Furthermore, the median sale price for houses in San Jose del Cabo was $548,050 — well below the average. This points to a healthy mix of entry-level and mid-range homes on the market.
- Finally, the San Jose Corridor is still the top spot for luxury buyers. For example, just 3 house sales averaged nearly $7 million each and brought in over $20 million in total volume alone.
For Sellers
- Above all, pricing at or just below market value is key. Because the average gap between sale and list price was -$45,872, buyers are clearly pushing back, and homes priced too high are sitting.
- Moreover, with homes taking an average of 275 days to sell, good photos, clean staging, and early marketing are all vital to avoid a long time on the market.
- Finally, co-op sales brought in $54.2 million in volume — more than non co-op sales. As a result, working with a well-connected local agent gives sellers a real edge.
Full Zone Comparison — Condos & Houses
| Zone | Units | Avg Sale Price | Median Sale Price | Avg DOM |
| CONDOS | ||||
| San Jose del Cabo | 9 | $498,843 | $536,751 | 227 |
| San Jose Corridor | 7 | $2,669,880 | $2,350,000 | 560 |
| Cabo San Lucas | 4 | $640,500 | $274,500 | 236 |
| Cabo Corridor | 7 | $235,657 | $230,000 | 329 |
| Pacific | 6 | $453,300 | $464,950 | 358 |
| HOUSES | ||||
| San Jose del Cabo | 10 | $730,227 | $548,050 | 237 |
| San Jose Corridor | 3 | $6,916,667 | $6,450,000 | 490 |
| Cabo San Lucas | 5 | $507,537 | $183,333 | 176 |
| Cabo Corridor | 7 | $1,521,143 | $1,000,000 | 354 |
| East Cape | 5 | $434,000 | $390,000 | 245 |
| La Paz | 9 | $330,476 | $378,788 | 135 |
| Pacific | 5 | $498,406 | $445,000 | 237 |
Thinking About Buying or Selling in San Jose del Cabo?
The February numbers tell a clear story: San Jose del Cabo is one of the most active and open entry points into the Los Cabos market. Meanwhile, the San Jose Corridor keeps setting the bar for top-end prices in all of Baja California Sur.
Whether you are looking for a condo under $500K, a luxury home in Querencia or Palmilla, or a plot of land to build your dream home, the data shows there is real value across all price ranges. However, with homes taking an average of 275 days to sell, getting expert help early gives you a real edge.
As a result, reach out to Pose Knows Cabo for a custom property search based on your budget, timing, and goals. We know every area in the corridor and are here to help you buy or sell in Los Cabos with full confidence.Source: FlexMLS Los Cabos Sales Statistics Report, February 1–28, 2026. Prepared by Angie Posey-Villa. Data is deemed reliable but not guaranteed